Preamble
It’s time to get busy again now that summer is coming to an end. I’ve been working on our Open Source PostgreSQL monitoring tool pgwatch2 over the past few weeks, adding yet another set of practical management / scaling features as well as a few more minor improvements. Both the GitHub queue and a few larger organizations that use the tool on a larger scale requested those. By the way, this is the fourth “Feature Pack” in 1.5 years, and after implementing the features listed below, we consider the software to be “ripe,” meaning that there are no critical features still lacking. We’re also happy that a lot of people have recently provided feedback, which has helped us improve the program even more and, hopefully, helped the PostgreSQL community gain more from the software. To learn more about the most significant updates in this v1.4.0 update, read on.
Getting friendly with Ansible & Co
We have attempted to make pgwatch2 simpler to deploy on a larger scale, similar to the previous update. There is nothing new this time around regarding containerization, but we have added the capability to enable repeatable, configuration-based deployments! Meaning that one can easily deploy the metrics collector to each required DB node and push metrics directly to InfluxDB or Graphite by adding a configuration file(s) with connect strings, metric selections / intervals, and the metric definitions themselves to some version control, configuration management, or application deployment system. Additionally, in environments with firewalls, this works better.
Performance
The previously supported centrally managed metrics gatherer / configuration database approach still functions, but one can now add a logical grouping label to the monitored hosts and then deploy separate gatherers for subset(s) of hosts based on that label if the number of servers grows too large (hundreds and above) to be handled by one central gatherer without lag. Other performance changes that help to increase throughput include batching of metric storage request requests and connection pooling.
Metrics / Dashboards
Like usual, there are a few new pre-defined metrics as well. The most notable of these are “psutil” based system statistics (CPU, RAM, and disk information), 2 “preset configs” (the “unprivileged” one for regular login users / developers might be the most useful), and new dashboards to go with those metrics. Reminder: The provided dashboards can be used as inspiration for user modifications rather than as something that must be used “as is.”
To make them more user-friendly for beginners, some other dashboards (such as the DB overview) also underwent some minor changes.
Ad-hoc monitoring of a single DB
We’ve added a flag or environment variable to start monitoring based on a typical JDBC connect string input for those brief troubleshooting sessions where you really don’t want to spend too much time setting up something temporary. Superusers will particularly benefit from this since all necessary “helper functions” will then be created automatically. NB! Unprivileged users may also want to start with the corresponding “DB overview – Unprivileged” dashboard and add the PW2_ADHOC_CONFIG=unprivileged environment variable to the sample below.
docker run --rm -p 3000:3000 --name pw2 \ -e PW2_ADHOC_CONN_STR="postgresql://pgwatch2@localhost/pgwatch2" \ cybertec/pgwatch2
Most important changes for v1.4.0
NB!
As always, any feedback is greatly appreciated!
- In-file mode
There is no longer a strict requirement for a central configuration database.
- Ad-hoc setting
JDBC connect string-based “single command launch” is used for transient monitoring sessions.
- A new “group” designation for sharding and logical grouping
when the number of monitored DBs becomes too large for a single gatherer daemon to handle, or when different criticality requirements exist.
- constant creation of new DBs
The gatherer daemon can now look for new databases on the cluster on a regular basis and automatically start monitoring them.
- unique tags
Users can now add any fixed labels or tags (for example, environment or app names) to all metric points gathered on a specific database.
- A gatherer daemon stats/health interface
Dump JSON on metrics collection progress.
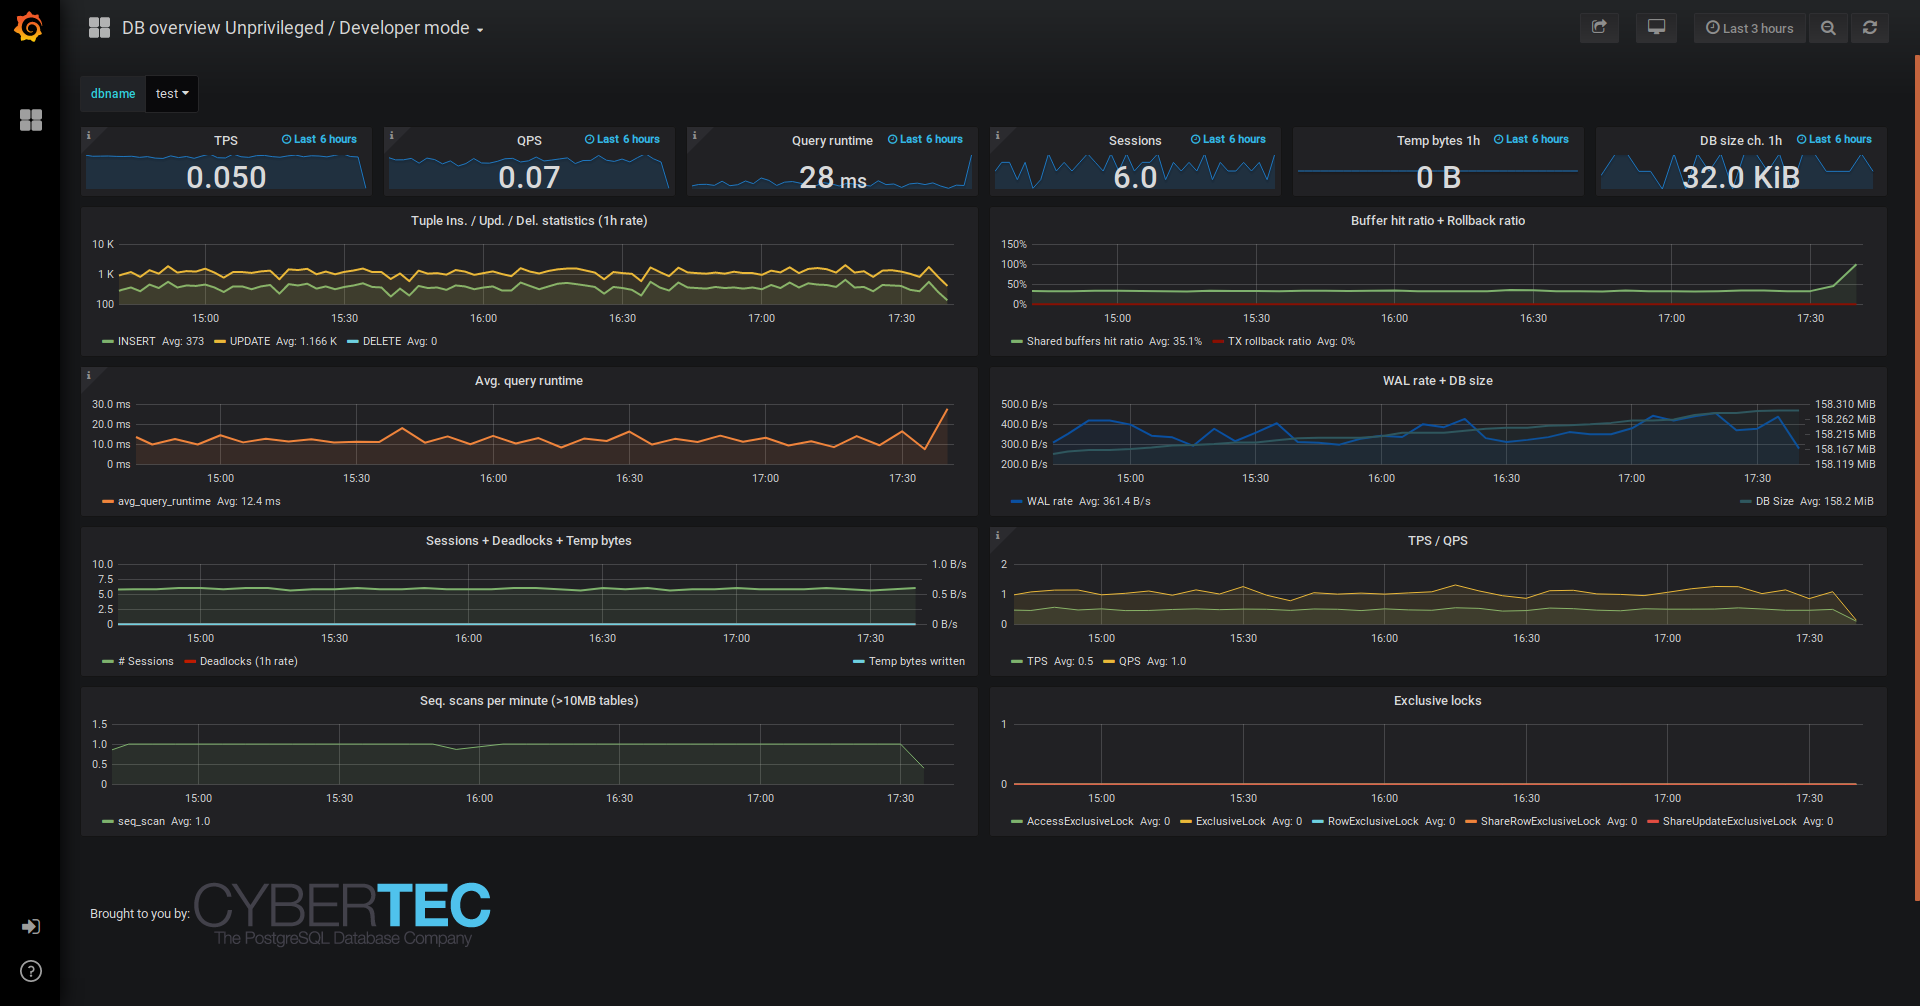
- New dashboard: Developer / Unprivileged DB overview
uses only metrics that are available to all Postgres users who can connect to a database; the only additional metrics available are “pg_stat_statements.”
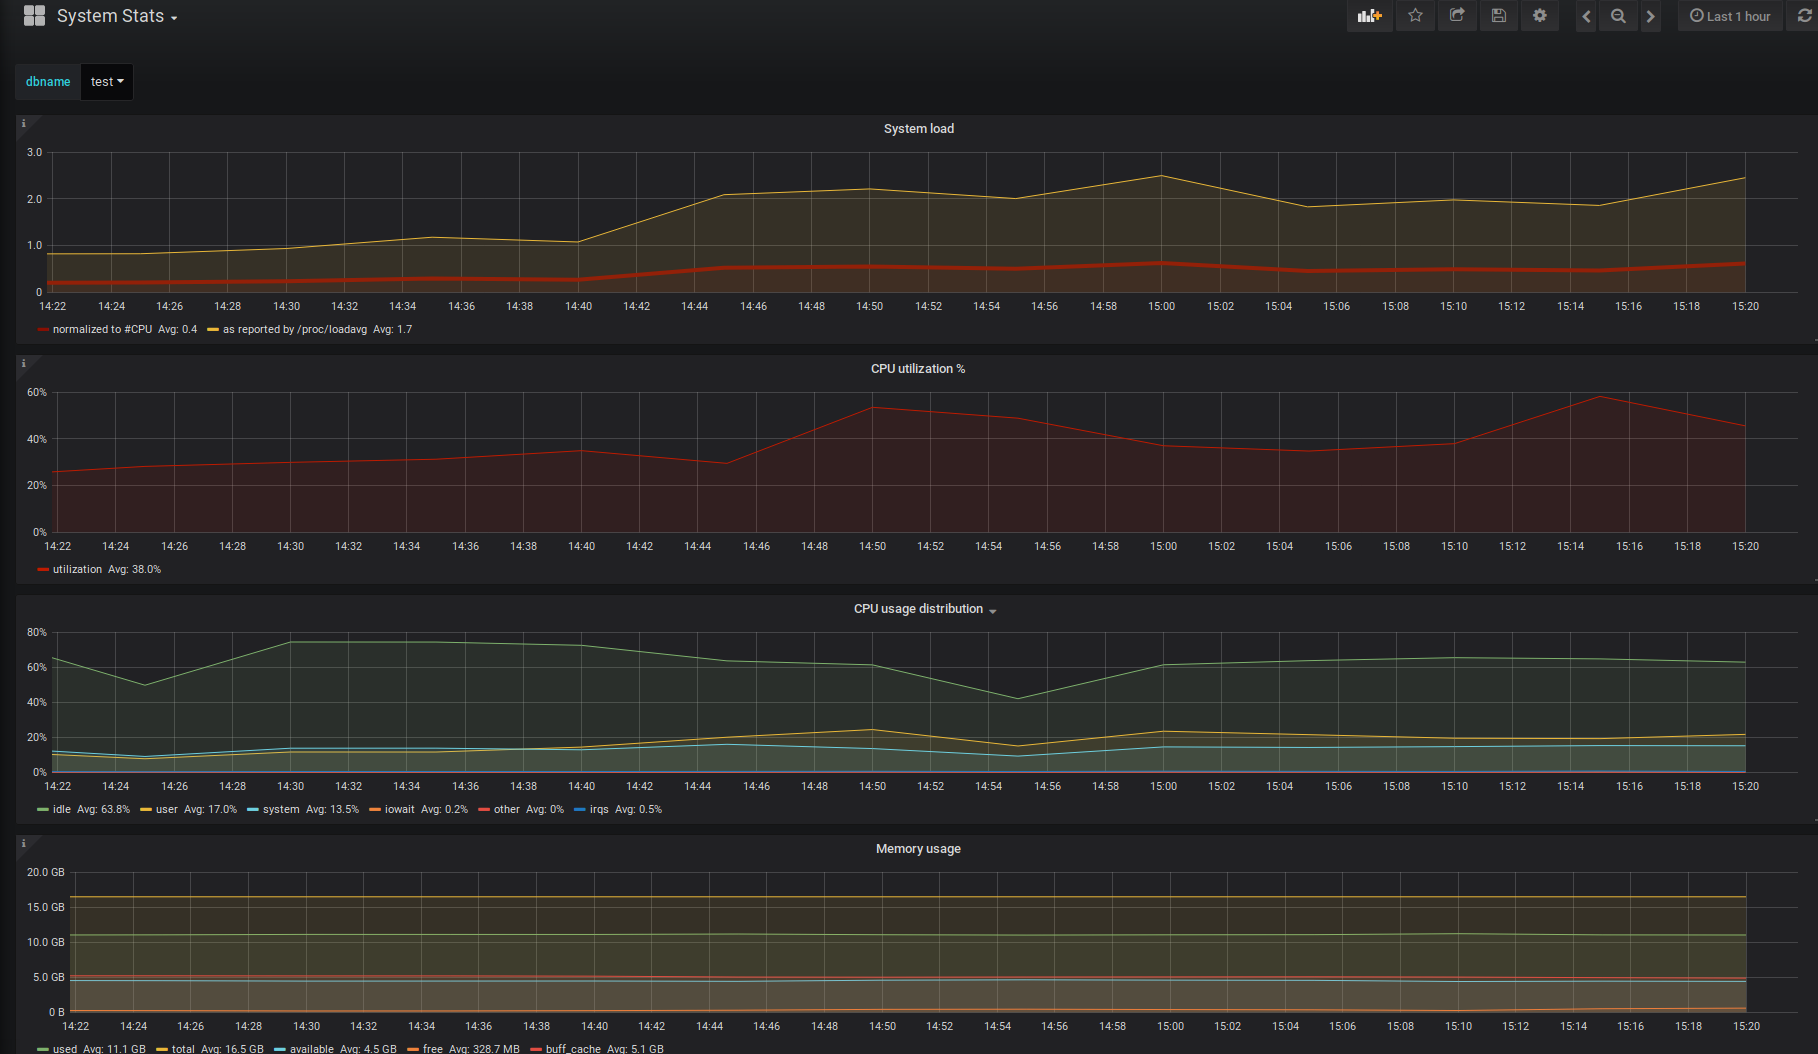
- System Stats is a new dashboard.
The monitored DB host requires the psutil Python package and PL/Python. It provides detailed information about the processor, memory, and disk. All this happens with the help of appropriate helpers and metrics.
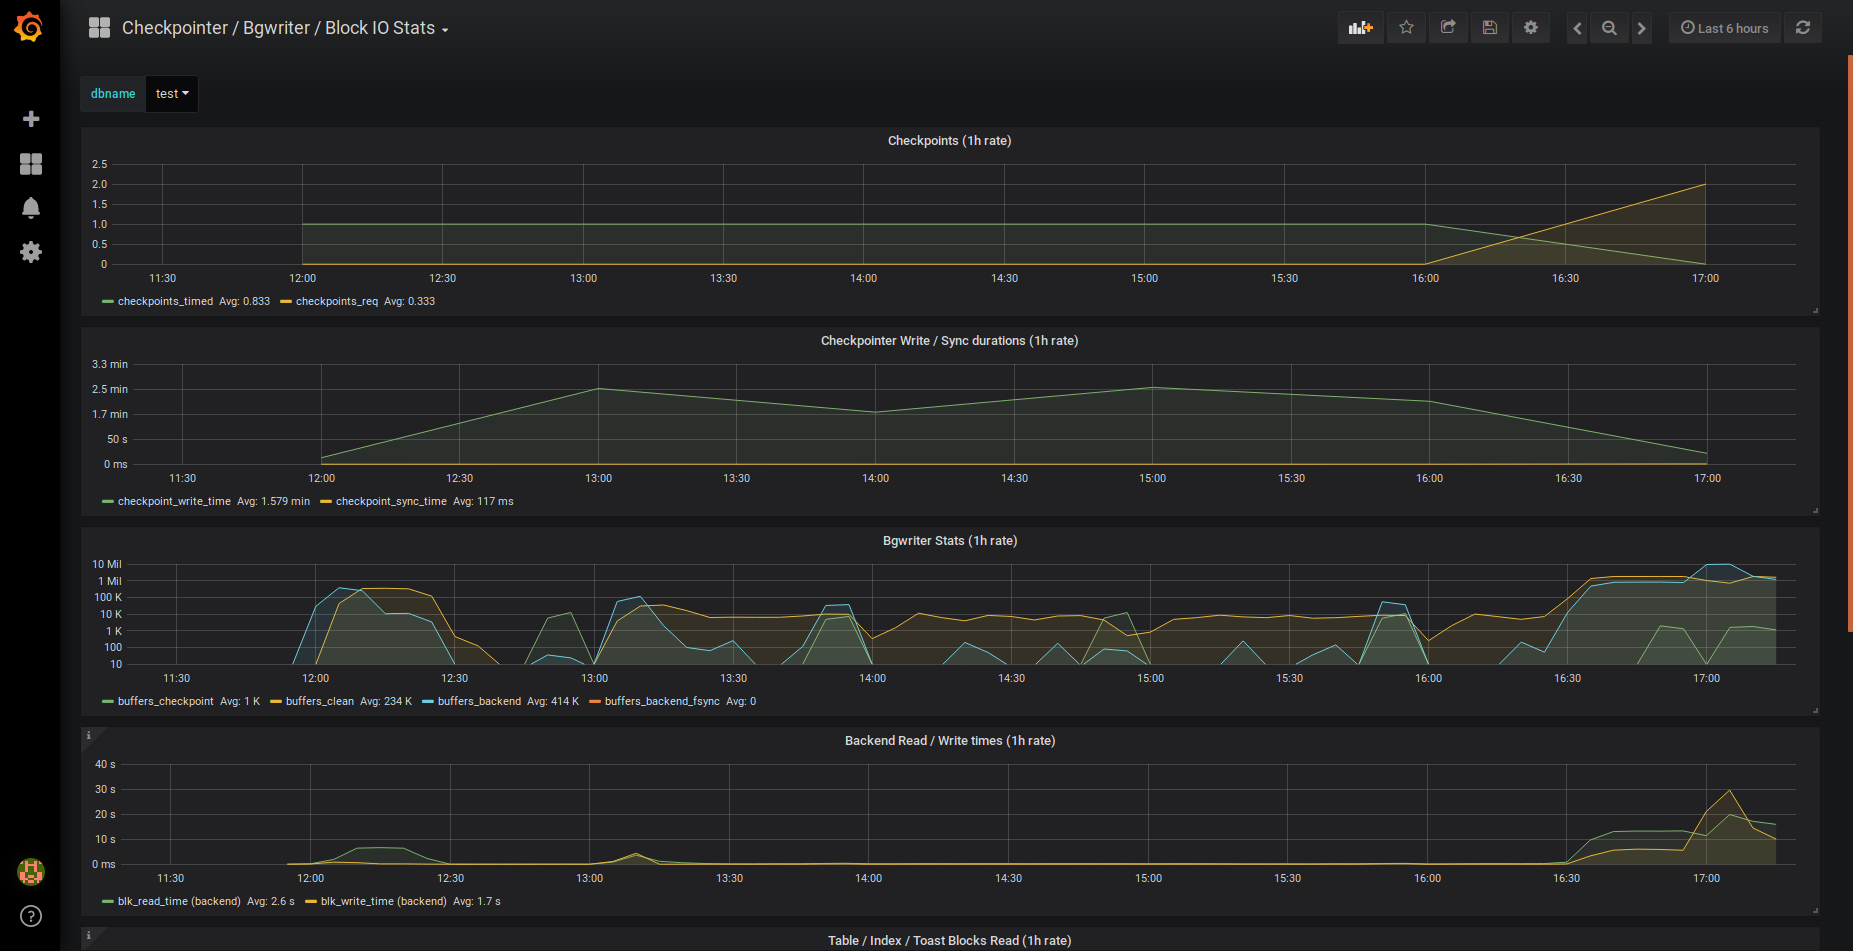
- Checkpointer/Bgwriter/Block IO Stats on a new dashboard
Based on internal Postgres metrics, checkpoint frequencies, background writers, and block IO are visualized.
- 1s gathering intervals are now supported by the gatherer daemon.
- connection pooling on watched databases
Significant improvement for brief intervals of gathering.
- requests for InfluxDB metric storage in batches
reduces metrics arrival lag significantly when there is significant latency to InfluxDB.
New features are constantly being added to pgwatch2 and it is being improved.
Screenshots of new Dashboards
DB overview No-Powerful / Developer
System Stats (based on psutil)
Block IO Stats, Bgwriter, and Checkpointer
We truly hope that you find this material useful. You may also find some articles of interest on the Enteros website’s blog. We appreciate your time.
About Enteros
Enteros offers a patented database performance management SaaS platform. It finds the root causes of complex database scalability and performance problems that affect business across a growing number of cloud, RDBMS, NoSQL, and machine learning database platforms.
The views expressed on this blog are those of the author and do not necessarily reflect the opinions of Enteros Inc. This blog may contain links to the content of third-party sites. By providing such links, Enteros Inc. does not adopt, guarantee, approve, or endorse the information, views, or products available on such sites.
Are you interested in writing for Enteros’ Blog? Please send us a pitch!
RELATED POSTS
Optimizing Logical Models in Financial Services with Enteros: Advancing Database Technology for Peak Performance
- 12 February 2025
- Database Performance Management
In the fast-evolving world of finance, where banking and insurance sectors rely on massive data streams for real-time decisions, efficient anomaly man…
Optimizing Database Performance in the Agriculture Sector with Enteros: Leveraging Observability for Sustainable Growth
- 11 February 2025
- Database Performance Management
In the fast-evolving world of finance, where banking and insurance sectors rely on massive data streams for real-time decisions, efficient anomaly man…
Optimizing Database Performance with Enteros: Leveraging Generative AI, FinOps, and RevOps for Cost-Efficient Growth
In the fast-evolving world of finance, where banking and insurance sectors rely on massive data streams for real-time decisions, efficient anomaly man…
Optimizing Database Software Applications in the Education Sector with Enteros: Leveraging Cloud FinOps and Performance Management for Cost-Efficient Operations
- 10 February 2025
- Database Performance Management
In the fast-evolving world of finance, where banking and insurance sectors rely on massive data streams for real-time decisions, efficient anomaly man…