Preamble
In Windows, when the operating system crashes, an emergency memory dump is automatically created and saved in the Windows system directory in the MEMORY.DMP file (%SystemRoot%\MEMORY.DMP).
This file helps to determine the cause of operating system failure and determine the process that may have caused the OS to shut down. The memory dump file can be several gigabytes in size, so special tools are required to analyze it.
The steps to be taken to analyze the MEMORY.DMP emergency memory dump file
To read the MEMORY.DMP file, you will need a special utility: Debugging Tools for Windows (WinDbg), which is part of Windows 10 SDK, you can download it here: Windows 10 SDK, both as an installer and as an ISO file.
The SDK (software development kit) is a development kit that allows software professionals to create applications for a specific software package, software basic development tools, hardware platform, computer system, game consoles, operating systems and other platforms.
Installing Debugging Tools for Windows from the Software Development Kit (SDK)
1. Run the installation file on the computer where the MEMORY.DMP emergency memory dump analysis will be performed.
2. Select the installation path and press Next 2 times.
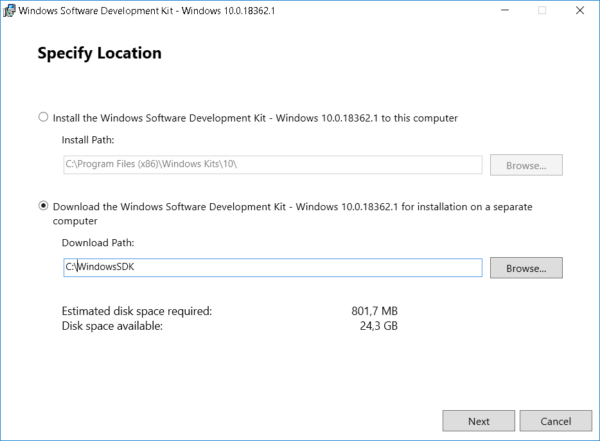
3. Adopt license agreement
4. Select Debugging Tools for Windows in the window of selecting a set of utilities to be installed (you won’t need any other items to analyze the memory dump) and press Install
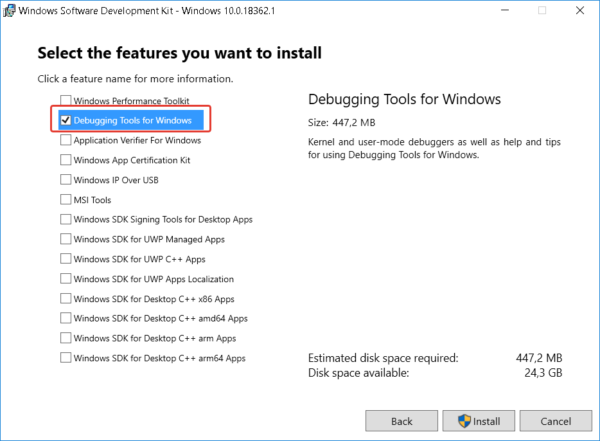
5. When the installation is complete, press Close
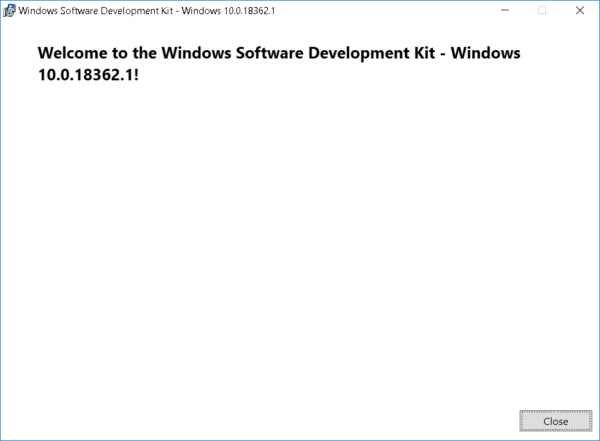
The Debugging Tools for Windows utility is installed.
MEMORY.DMP emergency memory dump analysis
1. Run the installed WinDbg utility and select Open Crash Dump in the File menu.
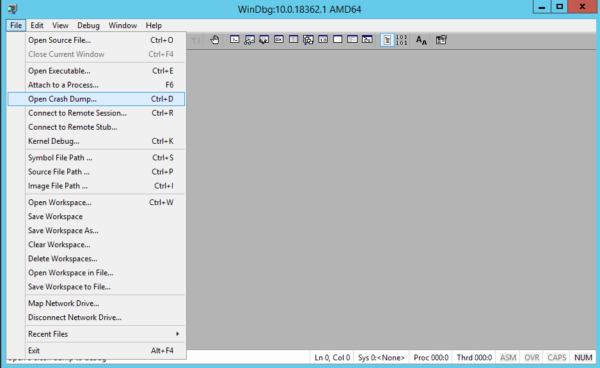
2. In the file opening window, go to the MEMORY.DMP file path and open it
3. After studying the headlines, click on the link: !analyze -v or enter this command manually
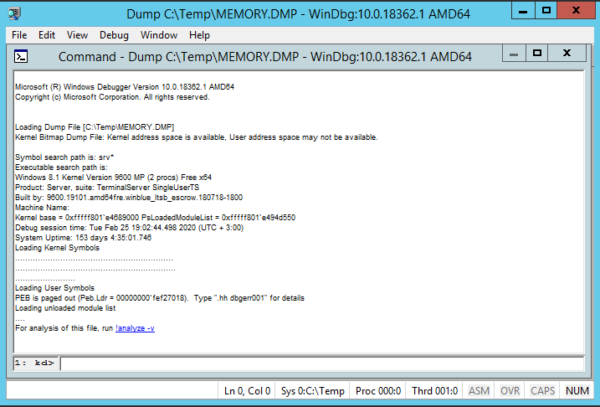
4. Waiting for some time for the utility to read the file and search for errors
5. Analyzing information about the process that caused Windows to crash
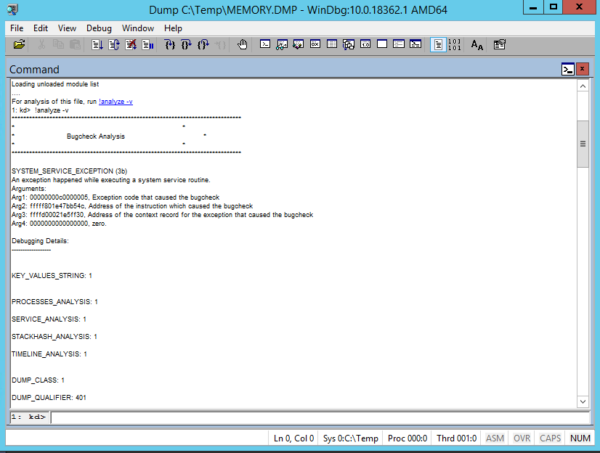
Using this information, you can understand which process caused the OS crash.
If the specified process belongs to the software manufacturer, you can refer to it with the corresponding case.
About Enteros
Enteros offers a patented database performance management SaaS platform. It proactively identifies root causes of complex business-impacting database scalability and performance issues across a growing number of clouds, RDBMS, NoSQL, and machine learning database platforms.
The views expressed on this blog are those of the author and do not necessarily reflect the opinions of Enteros Inc. This blog may contain links to the content of third-party sites. By providing such links, Enteros Inc. does not adopt, guarantee, approve, or endorse the information, views, or products available on such sites.
Are you interested in writing for Enteros’ Blog? Please send us a pitch!
RELATED POSTS
Optimizing Database Performance and Cloud FinOps in the Insurance Sector with Enteros and AWS CloudFormation
- 3 April 2025
- Database Performance Management
In the fast-evolving world of finance, where banking and insurance sectors rely on massive data streams for real-time decisions, efficient anomaly man…
Driving Growth and RevOps Efficiency in the Technology Sector with Enteros
In the fast-evolving world of finance, where banking and insurance sectors rely on massive data streams for real-time decisions, efficient anomaly man…
Enhancing Healthcare Efficiency with Enteros: AIOps-Driven Database Performance Monitoring
- 2 April 2025
- Database Performance Management
In the fast-evolving world of finance, where banking and insurance sectors rely on massive data streams for real-time decisions, efficient anomaly man…
Optimizing Cost Estimation and RevOps Efficiency with Enteros: Enhancing Financial Stability and Balance Sheet Management
In the fast-evolving world of finance, where banking and insurance sectors rely on massive data streams for real-time decisions, efficient anomaly man…